


gleplot lets you write plotting code the way you would for matplotlib and get a GLE (Graphics Layout Engine) script out, which GLE compiles to publication-quality PDF, EPS, SVG, PNG or JPG.
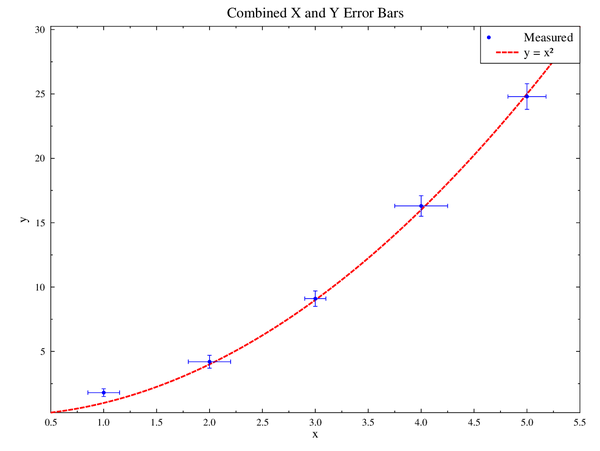
The code that draws it (the gallery's Combined X+Y Error Bars example):
import numpy as np
import gleplot as glp

x = np.array([1.0, 2.0, 3.0, 4.0, 5.0])
y = np.array([1.8, 4.2, 9.1, 16.3, 24.8])
xerr = np.array([0.15, 0.20, 0.10, 0.25, 0.18])
yerr = np.array([0.3, 0.5, 0.6, 0.8, 1.0])

fig = glp.figure(figsize=(8, 6))
ax = fig.add_subplot(111)
ax.errorbar(x, y, yerr=yerr, xerr=xerr, fmt="o", color="blue", capsize=4,
            label="Measured")
x_fit = np.linspace(0.5, 5.5, 100)
ax.plot(x_fit, x_fit**2, color="red", linestyle="--", label="y = x²")
ax.set_xlabel("x")
ax.set_ylabel("y")
ax.set_title("Combined X and Y Error Bars")
ax.legend()

fig.savefig("fit.gle")  # the GLE script and its data files; GLE not needed
fig.savefig("fit.pdf") # compiled by GLE- The output is a script you can read and edit.
fit.gleis a short plain-text GLE file, with the data in.datfiles beside it. Change a label or a colour by hand, and GLE compiles it to vector PDF, EPS or SVG, or to PNG or JPG. - Scripts open again.
glp.open_gle("fit.gle")reads a.glefile back into aFigureyou can change from Python and save. - Unrecognised GLE is kept. When you open a hand-written file, GLE that gleplot does not model is written back in place on save rather than dropped, and each place it had to keep raw GLE or guess is recorded as a note (opening GLE files).
- GLE is optional for writing. Saving
.gleworks without GLE installed; you need GLE only to compile.
gleplot needs Python 3.9 or later and numpy. Install it from GitHub:
pip install git+https://github.com/BenHuddart/gleplot.gitTo compile figures, install GLE 4.3+ from the GLE releases and check it with gle -info. GLE's include library (gleinc) is required too; the release packages ship it, and GLE's include library covers a GLE built from source. The getting started guide covers Ghostscript, LaTeX and gle -finddeps.
To work on gleplot itself, use an editable install with the development tools, as described in CONTRIBUTING.md:
git clone https://github.com/BenHuddart/gleplot.git
cd gleplot
pip install -e ".[dev]"- Lines, scatter, bars, steps, stems and histograms (plot types)
- Error bars, symmetric or asymmetric, in x and y
- Fills between curves
- Heatmaps and contours with colour bars
- Subplots and shared axes
- Log scales, secondary axes and polar plots
- Reference lines and shaded spans, text and arrows
- Series read from existing data files
The gallery shows every example with its code.
figure, subplots, plot, scatter, errorbar, savefig and the other matplotlib names take matplotlib's arguments. Where GLE cannot do what a keyword asks, gleplot accepts it and warns; the matplotlib migration guide lists each difference.
The documentation site has the user guides and the API reference.
See CONTRIBUTING.md. Questions and feature requests go to GitHub issues.
gleplot is licensed under the GPL-2.0 or later.