

Publication-grade, modular matplotlib plotting for geoscience.


nicefigs is a thin, composable layer on top of matplotlib for figures in
geoscience papers. It provides one consistent house style, physical figure
sizing that keeps fonts at their point sizes across every panel, and
ready-made plots for the figures geoscientists draw most: global and regional
maps, agreement plots, model comparisons, scorecards, time series, ternary
compositions, verification diagrams and map animations.
Every helper takes an existing ax where that makes sense, so nicefigs pieces
drop into your own matplotlib layouts.
 |
 |
 |
 |
 |
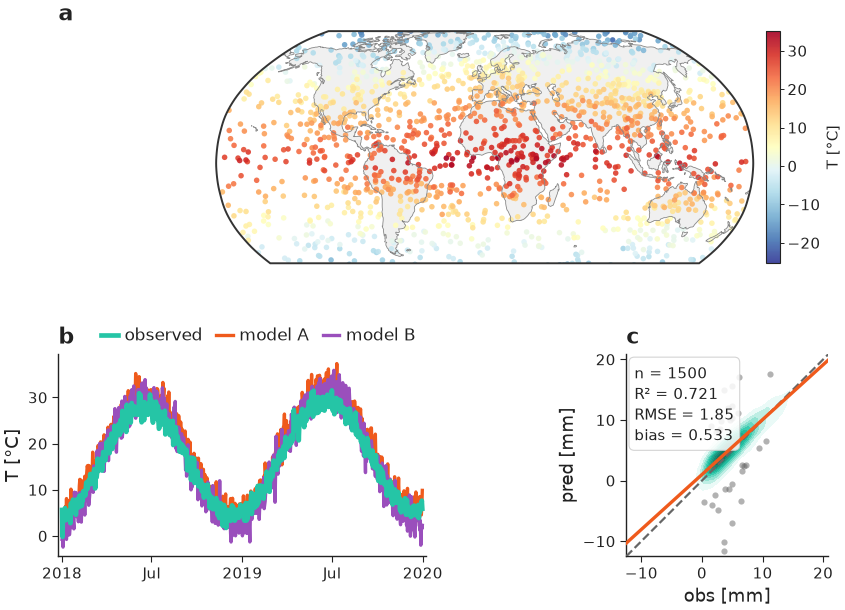 |
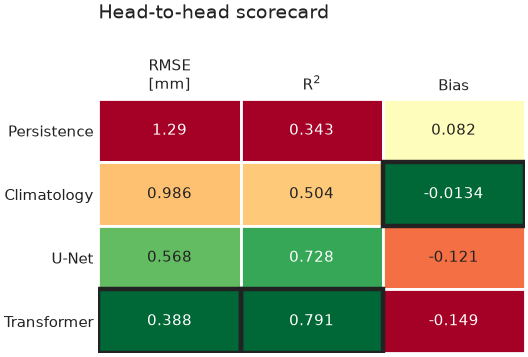
The gallery shows every plot type with the code that drew it.
pip install nicefigs              # core: matplotlib, numpy, scipy, pillow
pip install "nicefigs[maps]"      # + cartopy map projections and ocean clipping
pip install "nicefigs[all]"       # + cartopy and xarray
Python 3.10 or newer. Without cartopy, maps fall back to a plain equirectangular axes.
import nicefigs as nf
from nicefigs import data          # deterministic synthetic example data

nf.set_theme("paper")

# A single-column figure; the height is solved from the aspect.
fig, ax = nf.subplots(width="single", aspect=0.8)

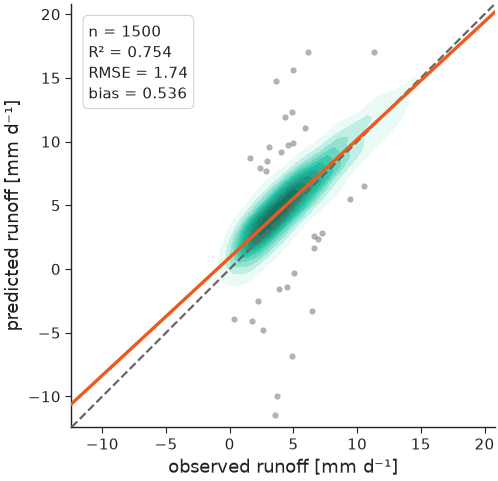
obs, pred = data.xy_agreement()
nf.agreement(obs, pred, ax=ax, units="mm d⁻¹")   # KDE density, 1:1 line, fit, metrics
nf.save(fig, "agreement", formats=("pdf", "png"))
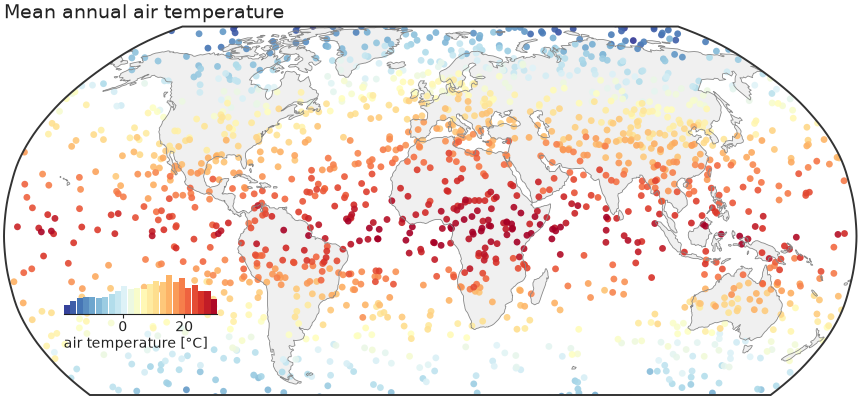
A global map with an inset-histogram colorbar:
import nicefigs as nf
from nicefigs import data

lon, lat, temp = data.global_points(field="temperature")
fig, ax, mappable = nf.map(lon, lat, temp, cmap="RdYlBu_r", colorbar_label="T [°C]")- One house style.
set_theme("paper" | "paper-large" | "talk" | "poster")globally, orwith nf.style(...):around existing matplotlib code. - Physical figure sizing.
width="single","double","slide", … plus an aspect; the free dimension is solved and fonts stay at their point sizes. - Maps. Robinson by default with Antarctica cropped, an inset histogram that doubles as the colorbar, ocean clipping, point, binned, raster, categorical and triangulated rendering, and regional extents.
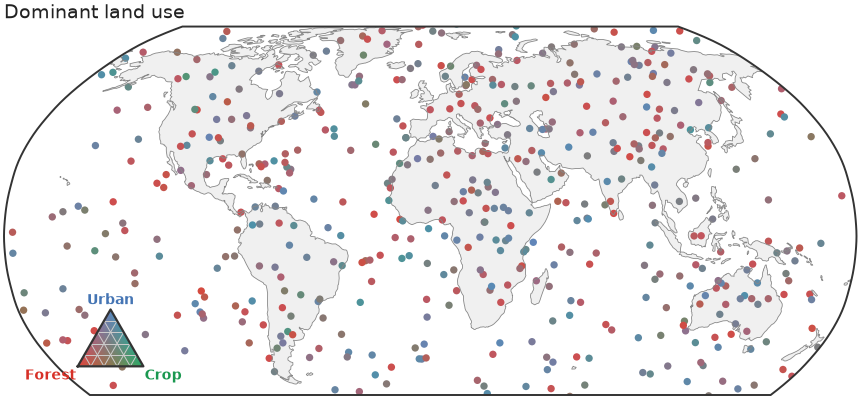
- Colour. Geoscience colormaps and diverging norms, land-cover palettes (ESA WorldCover, ESRI, MODIS), a role palette for comparison figures, artist palettes, ternary and bivariate 2D colormaps with matching legends.
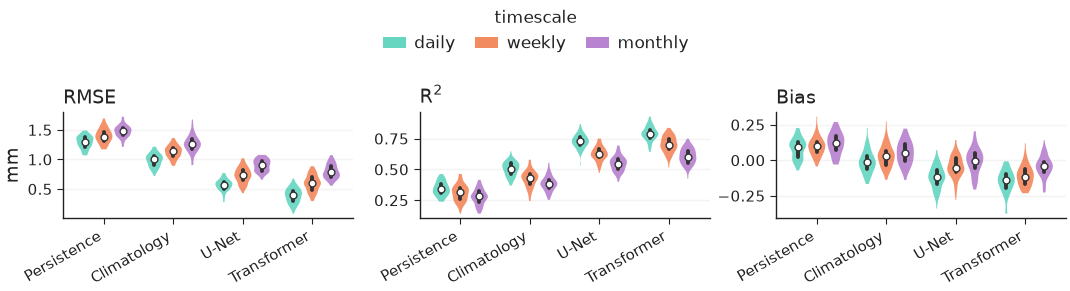
- Evaluation plots. Agreement plots, model-comparison violins, Taylor diagrams, scorecards with a skill-gap colouring, Pareto frontiers, caterpillar plots, reliability diagrams, rank histograms and precision–recall curves.
- Structure in space and time. Time series with ensemble bands, Hovmöller diagrams, cross-sections and vertical profiles, map animations to MP4 or GIF.
- Layout helpers. Panel labels, tight shared colorbars, facets, row and
column labels, and
check_text_overlapsto catch colliding text before submission.
The full documentation, with a user guide and the API reference, is at https://earthyscience.github.io/nicefigs.
git clone https://github.com/EarthyScience/nicefigs
cd nicefigs
uv venv && uv pip install -e ".[dev,docs]" && uv run pre-commit install
make check          # pre-commit + tests, exactly what CI runs
make gallery        # re-render docs/gallery and the README images
make docs-check     # run every README/docs code example against its shown output
See RELEASING.md for how a release is cut.
MIT — see LICENSE.