


This is a Prometheus exporter for Pi-hole's Raspberry PI ad blocker.
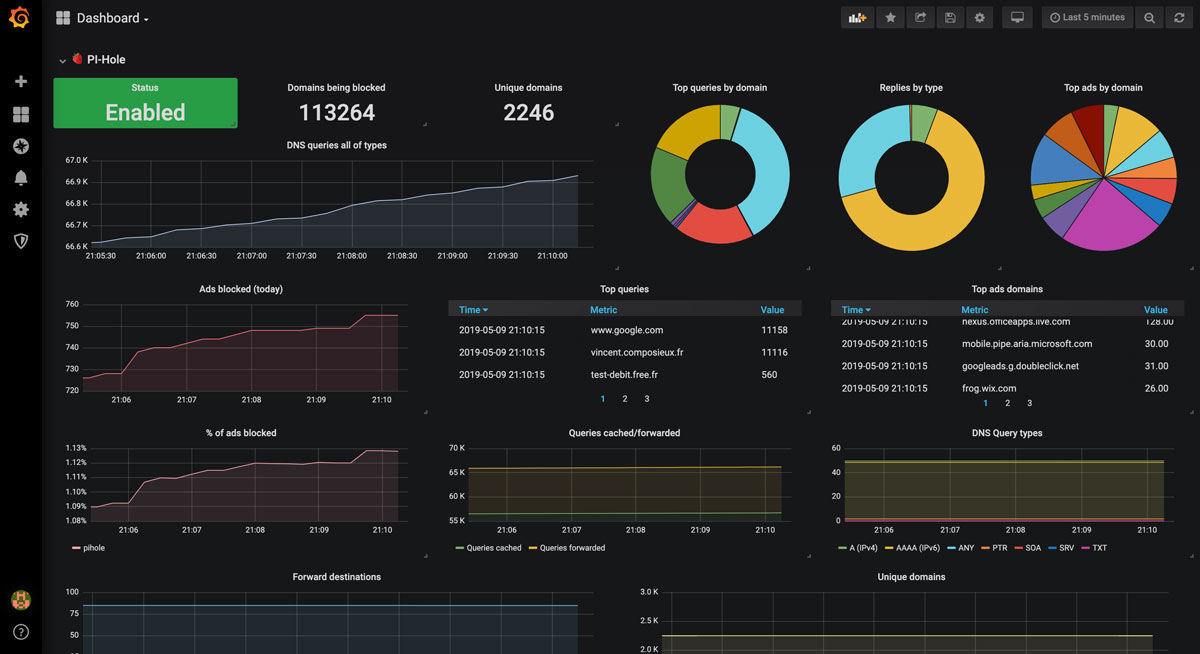
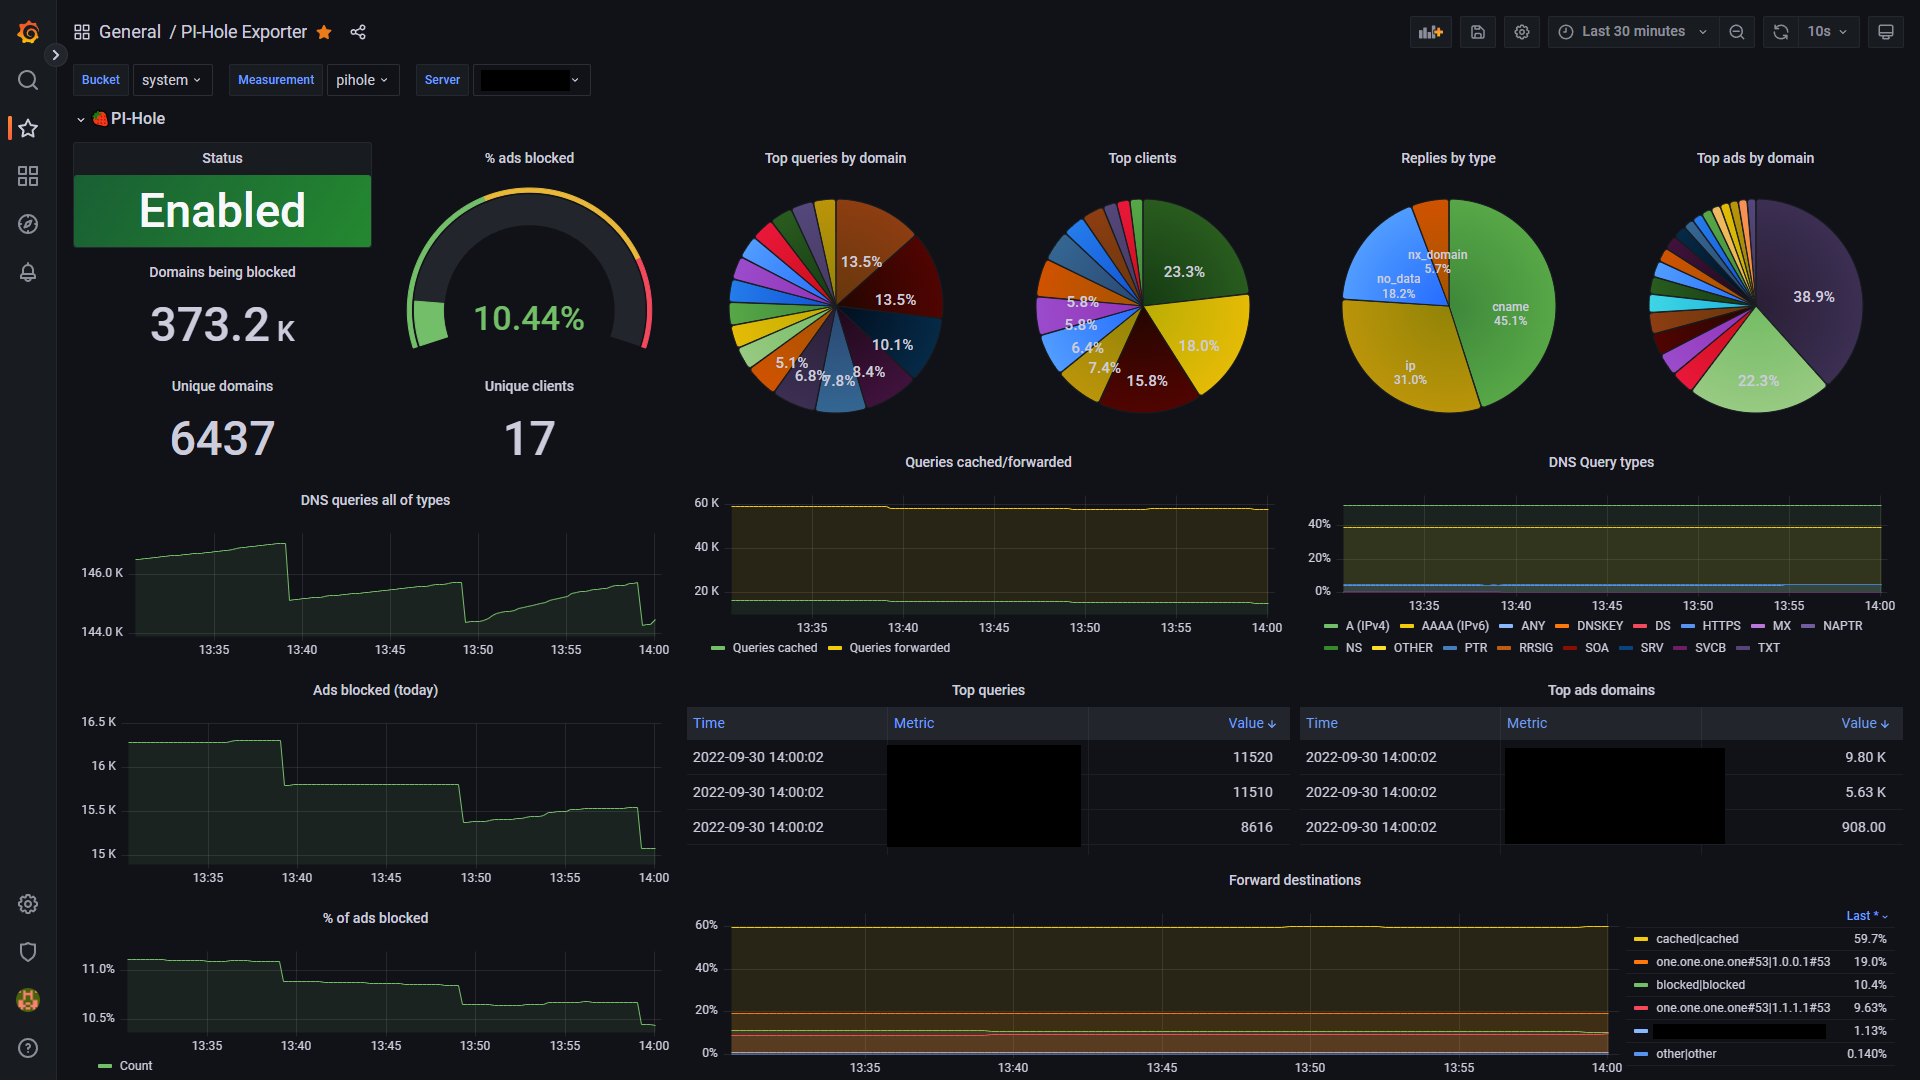
Available Grafana Dasboards:
- Prometheus: Grafana Labs / JSON/Github --> Preview
- InfluxDB 2 (Flux): Grafana Labs / JSON/Github --> Preview
You can download the latest version of the binary built for your architecture here:
- Architecture i386 [ Linux / Windows ]
- Architecture amd64 [ Darwin / Linux / Windows ]
- Architecture arm64 [ Darwin / Linux ]
- Architecture arm (32-bit) [ Linux ARMv7 (Raspberry Pi 2 and newer) / Linux ARMv6 (Raspberry Pi 1 and Zero) ]
Each binary comes with a .sha256.txt checksum file. Run ./pihole_exporter -version to print the version.
The exporter is also available as a Docker image
for linux/386, linux/amd64, linux/arm/v6, linux/arm/v7 and linux/arm64.
The latest tag points to the latest release, and master to the current development version.
You can run it using the following example and pass configuration environment variables:
$ docker run \
  -e 'PIHOLE_HOSTNAME=192.168.1.2' \
  -e 'PIHOLE_PASSWORD=mypassword' \
  -e 'PORT=9617' \
  -p 9617:9617 \
  ekofr/pihole-exporter:latest
PIHOLE_PASSWORD is either your Pi-hole web interface password or an application password,
which you can generate in the Pi-hole web interface under Settings > Web interface / API.
The container runs as a non-root user (UID/GID 65532): files mounted into it, such as a
PIHOLE_PASSWORD_FILE, must be readable by that user.
If Pi-hole is served over HTTPS, set PIHOLE_PROTOCOL=https (and usually PIHOLE_PORT=443).
The image ships the usual CA certificates, so certificates from a public CA work out of the box.
For a self-signed certificate, either mount your CA into /etc/ssl/certs or skip the verification
(do NOT do this on untrusted networks):
SKIP_TLS_VERIFICATION=true
When the exporter and Pi-hole run in the same Docker network, PIHOLE_HOSTNAME is the Pi-hole
container name and PIHOLE_PORT the port Pi-hole listens on inside its container (80 by default),
not the port published on the host.
A single instance of pihole-exporter can monitor multiple pi-holes instances. To do so, you can specify a list of hostnames, protocols, passwords/API tokens and ports by separating them with commas in their respective environment variable:
$ docker run \
  -e 'PIHOLE_PROTOCOL=http,http,http' \
  -e 'PIHOLE_HOSTNAME=192.168.1.2,192.168.1.3,192.168.1.4' \
  -e "PIHOLE_PASSWORD=$API_TOKEN1,$API_TOKEN2,$API_TOKEN3" \
  -e "PIHOLE_PORT=8080,8081,8080" \
  -e 'PORT=9617' \
  -p 9617:9617 \
  ekofr/pihole-exporter:latest
If port, protocol and API token/password is the same for all instances, you can specify them only once:
$ docker run \
  -e 'PIHOLE_PROTOCOL=http' \
  -e 'PIHOLE_HOSTNAME=192.168.1.2,192.168.1.3,192.168.1.4' \
  -e "PIHOLE_PASSWORD=$API_TOKEN" \
  -e "PIHOLE_PORT=8080" \
  -e 'PORT=9617' \
  -p 9617:9617 \
  ekofr/pihole-exporter:latest
Instead of putting the password/API token directly in an environment variable, you can point
PIHOLE_PASSWORD_FILE at a file (e.g. a Docker/Kubernetes secret) containing it. PIHOLE_PASSWORD_FILE
follows the same comma-separated rule as PIHOLE_PASSWORD: give it a single path to use for every host,
or one path per host. It cannot be combined with a non-empty PIHOLE_PASSWORD. Mount the secret read-only:
services:
  pihole-exporter:
    image: ekofr/pihole-exporter:latest
    environment:
      PIHOLE_HOSTNAME: 192.168.1.2
      PIHOLE_PASSWORD_FILE: /run/secrets/pihole_password
    volumes:
      - ./secrets/pihole_password.txt:/run/secrets/pihole_password:ro
    ports:
      - "9617:9617"
The image has no shell nor wget: to add a health check, use the exporter binary itself,
as in the provided docker-compose.yml:
    healthcheck:
      test: ["CMD", "./pihole-exporter", "-healthcheck"]
All the Pi-hole instances are exported from the same /metrics endpoint, each series having a
hostname label: Prometheus only needs to scrape the exporter once.
A Helm chart is maintained by the community.
If a Service named pihole exists in the same namespace, Kubernetes injects a PIHOLE_PORT
environment variable such as tcp://10.0.0.1:80 into the pod, which the exporter can't parse.
Set PIHOLE_PORT explicitly, or set enableServiceLinks: false in the pod spec.
Optionally, you can download and build it from the sources. You have to retrieve the project sources by using one of the following way:
$ go install github.com/eko/pihole-exporter@latest
# or
$ git clone https://github.com/eko/pihole-exporter.git
Then, build the binary (here, an example to run on Raspberry PI ARM architecture):
$ GOOS=linux GOARCH=arm GOARM=7 go build -o pihole_exporter .In order to run the exporter, type the following command (arguments are optional):
$ ./pihole_exporter -pihole_hostname 192.168.1.10 -pihole_password azertyEvery option can also be set with the matching upper-case environment variable, for example
PIHOLE_HOSTNAME for -pihole_hostname.
The log level is set with LOG_LEVEL or -log_level (debug, info, warn, error; info by default).
DEBUG=true or -debug is a shortcut for the debug level. Info and debug logs are written to stdout,
warnings and errors to stderr.
time="2026-10-26T21:43:53+01:00" level=info msg="starting pihole-exporter v1.3.0"
time="2026-10-26T21:43:53+01:00" level=info msg="listening on 0.0.0.0:9617"
Once the exporter is running, you also have to update your prometheus.yml configuration to let it scrape the exporter:
scrape_configs:
    - job_name: "pihole"
      static_configs:
          - targets: ["localhost:9617"]
If you are using Grafana Alloy, add a scrape component to your config.alloy and forward it to your own prometheus.remote_write component:
prometheus.scrape "pihole" {
  targets    = [
    {"__address__" = "localhost:9617"},
  ]
  forward_to = [prometheus.remote_write.default.receiver]
}# Hostname(s) of the Pi-hole instance(s), comma-separated
-pihole_hostname value (default "127.0.0.1")
# Protocol(s) used to reach Pi-hole: http or https
-pihole_protocol value (default "http")
# Port(s) of the Pi-hole web interface
-pihole_port value (default 80)
# Password(s) or application password(s) of the Pi-hole web interface
-pihole_password value
# File(s) containing the password(s), instead of -pihole_password
-pihole_password_file value
# Timeout to connect and retrieve data from a Pi-hole instance
-timeout duration (default 5s)
# Address and port the exporter listens on
-bind_addr string (default "0.0.0.0")
-port uint (default 9617)
# Accept any certificate and skip hostname checks: do NOT use on untrusted networks!
-skip_tls_verification
# Log level: debug, info, warn or error
-log_level string (default "info")
# Shortcut for -log_level debug
-debug
# Print the version and exit (must be the first argument)
-version
# Check that a running exporter answers, for container health checks (must be the first argument)
-healthcheck| Metric name | Description |
|---|---|
| pihole_domains_being_blocked | This represent the number of domains being blocked |
| pihole_dns_queries_today | This represent the number of DNS queries made over the current day |
| pihole_ads_blocked_today | This represent the number of ads blocked over the current day |
| pihole_ads_percentage_today | This represent the percentage of ads blocked over the current day |
| pihole_unique_domains | This represent the number of unique domains seen |
| pihole_queries_forwarded | This represent the number of queries forwarded |
| pihole_queries_cached | This represent the number of queries cached |
| pihole_clients_ever_seen | This represent the number of clients ever seen |
| pihole_unique_clients | This represent the number of unique clients seen |
| pihole_dns_queries_all_types | This represent the number of DNS queries made for all types |
| pihole_reply | This represent the number of replies made for all types |
| pihole_top_queries | This represent the number of top queries made by Pi-hole by domain |
| pihole_top_ads | This represent the number of top ads made by Pi-hole by domain |
| pihole_top_sources | This represent the number of top sources requests made by Pi-hole by source host |
| pihole_top_sources_blocked | This represent the number of blocked queries made by the top blocked source hosts |
| pihole_forward_destinations | This represent the number of forward destinations requests made by Pi-hole by destination |
| pihole_forward_destinations_responsetime | This represent the average response time of each forward destination, in seconds |
| pihole_forward_destinations_responsevariance | This represent the variance of the response time of each forward destination |
| pihole_request_rate | This represent the number of DNS queries per second |
| pihole_querytypes | This represent the number of queries made by Pi-hole by type |
| pihole_status | This represent if Pi-hole blocking is enabled (1) or disabled (0) |